Can Google Gemini GEM replace Spreadsheet calc?
Every financial analyst has built the same spreadsheet a dozen times: initial outlay in one cell, a row of projected cash flows, a discount rate, and a NPV() formula doing the heavy lifting underneath. It works. It’s also entirely disposable — the moment the workbook is closed, the logic that produced the number goes with it, and the next person who wants an NPV starts from a blank sheet or hunts down last year’s file.
So I set myself a small challenge: could a Google Gemini Gem — a custom-instructed version of Gemini — replace that spreadsheet for early-stage investment screening? Not “does it produce a plausible-looking number,” but “does it get the same NPV and IRR I’d get from a properly built Excel model, and does it hold up as something I’d actually reuse.”
The instructions I gave it
Rather than asking Gemini to “calculate NPV” ad hoc each time, I wrote it a persistent system prompt — the thing that makes a Gem a Gem rather than a one-off chat:
You are a financial analysis assistant helping evaluate investment ideas
using Net Present Value (NPV) and related metrics.

When I describe an investment idea, gather:
- Initial investment / upfront cost
- Expected cash flows by period (and how many periods)
- Discount rate (or ask if I want help estimating one, e.g. via WACC
  or a comparable required rate of return)
- Currency and time unit (annual/monthly)

Then:
1. Show the NPV formula and calculate it step-by-step, period by period
   — don't just give the final number.
2. Also calculate IRR, payback period, and profitability index if I have
   enough data.
3. Flag key assumptions and how sensitive the result is to them
   (e.g. "if the discount rate is 2% higher, NPV drops to X").
4. If cash flow estimates seem optimistic or the discount rate seems
   mismatched to the risk level, say so directly.
5. Never present this as investment advice or a recommendation to
   proceed — present it as a calculation to inform my own decision.
6. If I give incomplete numbers, ask for what's missing rather than
   guessing.

Default to a clear table format: Period | Cash Flow | Discount Factor |
Present Value.
The point of steps 3–4 wasn’t decoration. A calculator that only spits out a final number is trivially easy to build and not very useful — the value is in the reasoning shown alongside it, and in a second opinion on whether the assumptions feeding the formula are sane in the first place.
The test case
I fed it a simple five-year investment: a $250,000 upfront cost, cash flows ramping from $60,000 in year one to $100,000 in year five, discounted at 10%. I’d already built the same case in Excel beforehand, so I had a number to check against before I ever saw what the Gem produced.
It came back with exactly the table format I’d specified:
| Period | Cash Flow | Discount Factor | Present Value |
|---|---|---|---|
| 1 | $60,000 | 0.9091 | $54,546 |
| 2 | $70,000 | 0.8264 | $57,848 |
| 3 | $80,000 | 0.7513 | $60,104 |
| 4 | $90,000 | 0.6830 | $61,470 |
| 5 | $100,000 | 0.6209 | $62,090 |
NPV = $296,058 − $250,000 = $46,058
Alongside it: IRR ≈ 16.4%, payback period ≈ 3.4 years, discounted payback ≈ 4.3 years, and a profitability index of 1.18. Every one of those matched my Excel model to the dollar (rounding aside). That was the baseline bar to clear — if the arithmetic had been off, nothing else about the exercise would matter.
Where it went further than the spreadsheet
Matching the spreadsheet was table stakes. What I didn’t expect was what came with the numbers:
- A sanity check on the cash flow curve. It flagged that a steady ~15–20% year-over-year ramp for five straight years is an aggressive assumption to take at face value, and asked what was driving it — new capacity coming online, market growth, pricing power — rather than silently accepting the inputs the way a spreadsheet does.
- A sensitivity read without being asked twice. “If the discount rate is 2 points higher, NPV drops to roughly $28,000” — the kind of one-line stress test that’s easy to skip in Excel because it means rebuilding a data table, but costs nothing to ask for here.
- A discount-rate reasonableness check. It compared the 10% rate against typical required-return ranges for the risk profile I described and said, plainly, whether it looked mismatched — something no
NPV()formula will ever do for you. - A refusal to play investment advisor. True to instruction 5, it consistently framed the output as “here’s the calculation” rather than “here’s what you should do” — which is exactly the line I wanted it to hold.
None of that is exotic. An experienced analyst does all of it as a matter of habit. But a spreadsheet doesn’t — it just computes what you told it to compute, and the “is this realistic” judgment lives entirely in the analyst’s head, applied inconsistently depending on who’s building the model that week.
Why the reusability matters more than the arithmetic
The NPV formula was never the hard part — Excel has done that correctly since 1985. The actual gap this closes is that the judgment around the formula — which assumptions to interrogate, which sensitivities to run, how to frame the output responsibly — now lives in a shareable, versioned set of instructions instead of in one analyst’s head or a scattered pile of one-off workbooks.
That’s the difference between a spreadsheet and a Gem: the spreadsheet is a single calculation, rebuilt from memory every time someone needs one. The Gem is the process for doing that calculation well, packaged once and handed to anyone in the organisation who needs to screen an investment idea — with the same rigor, the same sensitivity checks, and the same guardrails, every time.
Why this matters
This was a deliberately small, checkable test — I wanted a case where I could verify every number by hand before trusting anything the Gem told me. It passed that test cleanly. But the bigger signal is the direction it points: for a growing slice of analytical work, the unit of reuse is shifting from “a workbook someone built” to “an agent someone configured.” A well-instructed agent doesn’t just replicate the calculation — it replicates the analyst’s judgment around the calculation, and that’s the part that was never really reusable before.
I don’t expect Excel to disappear from finance any time soon, and this Gem isn’t a replacement for a fully built financial model with scenario tabs and audit trails. But for the fast, early screening work — “is this idea even worth building a full model for?” — I’m now reaching for the Gem first, and I expect more of that kind of workload to move the same way.
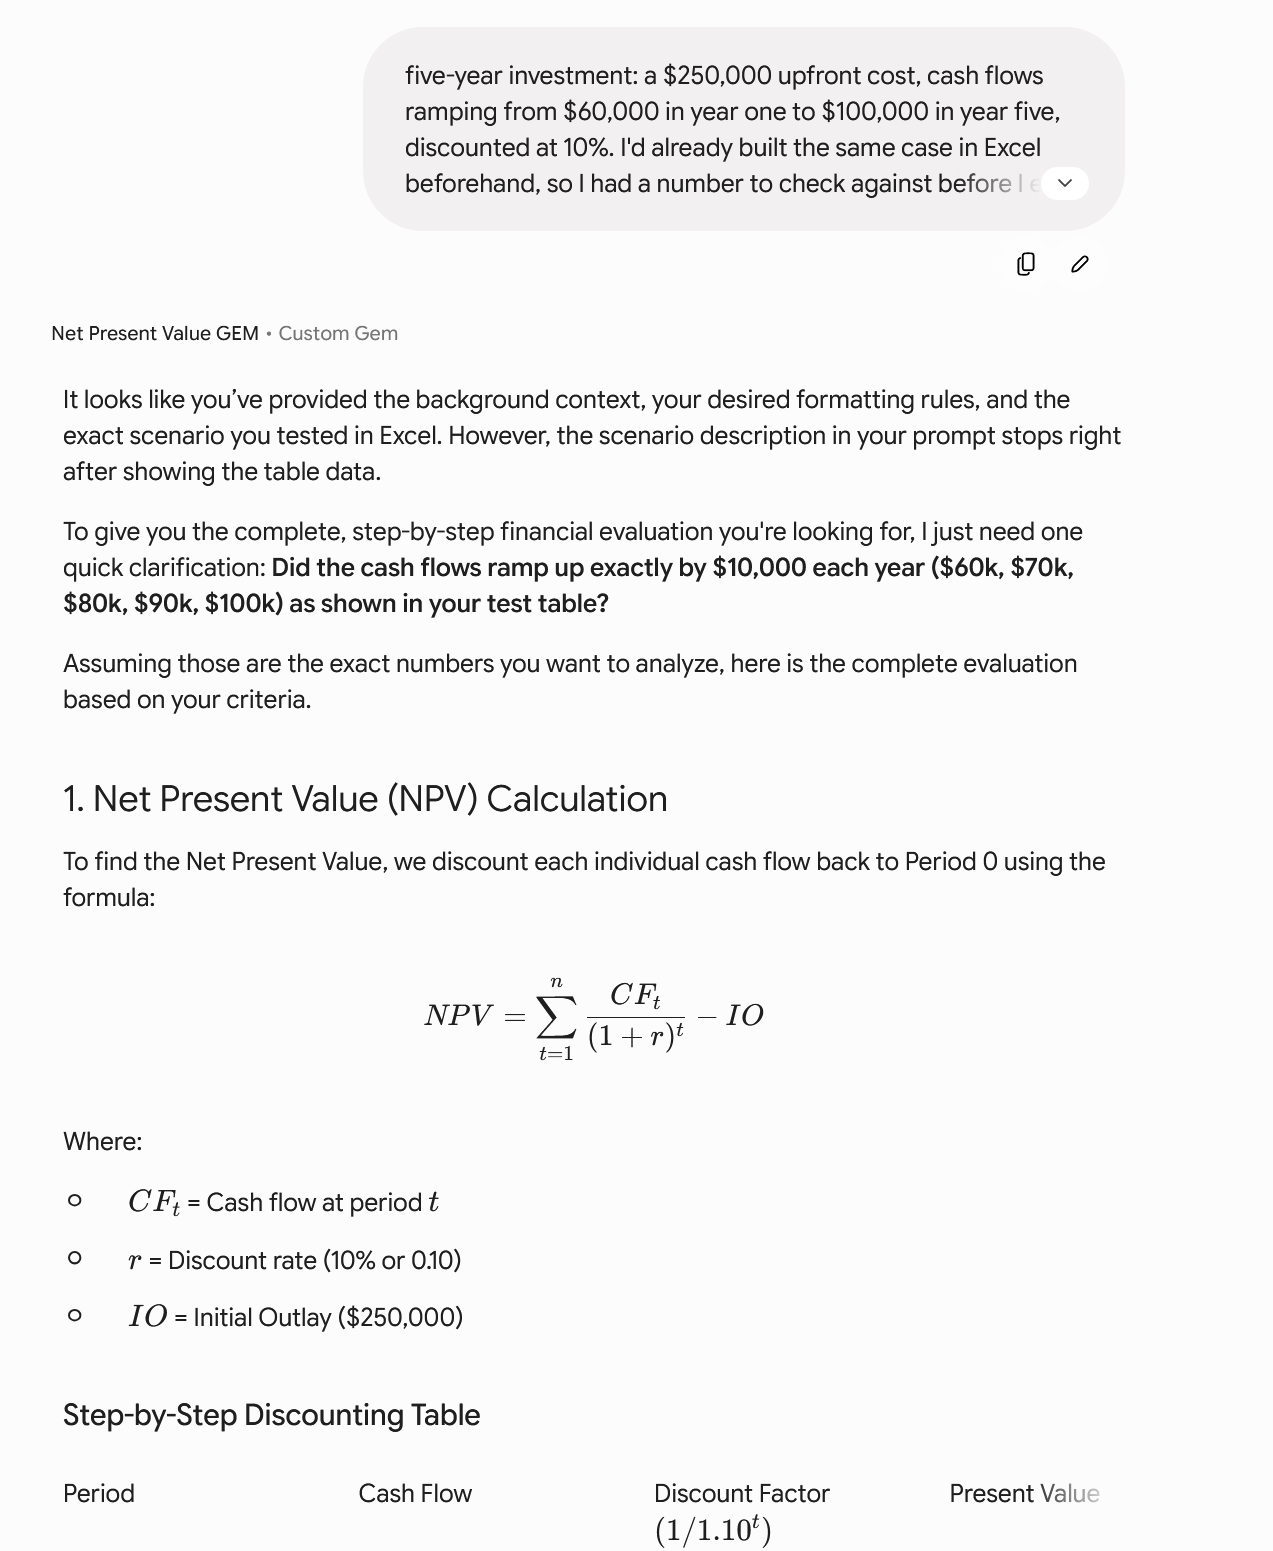
The Gem's step-by-step NPV calculation, matching the Excel model. Click to enlarge.