Vilnius Sunshine Report
Background
Lithuania’s national weather service doesn’t expose a clean public API for historical sunshine-duration data. ogimet.com, an independent aggregator of SYNOP station reports, does the closest thing: it publishes daily summaries — including the “Sun D-1” column (sunshine hours for the previous day) — for WMO station 26730 (Vilnius) through a queryable CGI endpoint that returns an HTML results table rather than JSON.
That’s enough to work with. The project reverse-engineers that endpoint into a de facto API: build the right query parameters, parse the returned HTML table with Python’s standard-library parser, and cache the results locally so the same day is never re-fetched twice. Two properties of the source data shaped the design from the start:
- ogimet throttles rapid requests, so fetching has to be deliberately slow and retry-tolerant rather than a single bulk pull.
- A day’s sunshine total isn’t final until the day is over — querying for “today” reliably fails. The fetch logic caps every request at yesterday and treats today as expected-but-not-yet-available, not as an error state.
What I built
Data layer. A fetch/cache module pulls monthly tables from ogimet,
parses them with html.parser, and stores daily values in a flat CSV. An
incremental “missing days” mode diffs the cache against the calendar and only
re-fetches genuine gaps, so routine updates are fast and polite to the source.
Desktop GUI. A tkinter app (stdlib only, no install step) wraps the
whole workflow for non-technical daily use: one-click buttons for a fast
missing-days update, a full re-fetch, a current-year-only refresh, and a
no-network report rebuild. Fetches run on a background thread with output
streamed live into an activity log, so the UI never freezes mid-fetch. A
status line always shows the latest cached date and the running year-over-year
totals.
HTML report. The primary output is a single self-contained
vilnius_sunshine_report.html: cumulative and daily sunshine curves,
monthly totals, and a full day-by-day comparison table, charted with Chart.js
and toggle-able between smoothed and raw daily views. It’s a static file —
double-click to open, no server required.
Kindle integration. The interactive report is built on Chart.js/canvas,
which doesn’t render on an e-reader’s browser. Rather than force-fit it, the
project builds a second, purpose-made edition: a dashboard is composited
entirely as one image, laid out in matplotlib using absolute figure
coordinates (headline stat, metric tiles, three grayscale charts) and
rendered at the exact pixel resolution of the target Kindle. A second page
does the same for a “this month vs. the same number of days last year” view,
with larger tiles and a single day-by-day bar chart. Calibre’s
ebook-convert turns the static HTML into a real .azw3 e-book (reflowable
metadata, proper cover, correct margins for the device profile), and the tool
auto-detects a connected Kindle by USB volume label and copies the book
straight into its library — one GUI button, no manual file wrangling.
Outcome
- A single “Send to Kindle” click now takes raw meteorological data all the way to a book sitting in the device’s library, with no manual conversion or file transfer step.
- The cache is safe to refresh daily: incremental fetching means routine runs touch only the last day or two of new data instead of re-pulling months of history.
- Two real integration bugs were found and fixed by treating the tool as a system to be debugged, not just written: an undocumented “reject queries for today” behavior in ogimet that was silently truncating fetches, and a multi-Python-install PATH ambiguity on the host machine that made a dependency appear “installed” for one interpreter and missing for the one actually running the GUI.
- The project is in ongoing daily use tracking 2025-vs-2026 sunshine for Vilnius, viewable equally well in a browser or on an e-ink screen.
Stack rationale
| Concern | Choice | Why |
|---|---|---|
| Core app (fetch, cache, GUI) | Python standard library only (urllib, html.parser, argparse, tkinter) |
Zero install friction — runs on any stock python.org install, nothing to package or distribute for a single-user tool. |
| Interactive report | Static HTML + Chart.js via CDN | No build step, no server; the whole dashboard is one portable file that opens in any browser. |
| Kindle charts | matplotlib (lazy-imported, only needed for the Kindle path) | E-ink needs pre-rendered raster images, not JS. Figure-fraction coordinates give pixel-exact control for hand-composing a dashboard layout rather than relying on a generic chart grid. |
| HTML → e-book conversion | Calibre’s ebook-convert CLI |
Correctly handles the AZW3/MOBI binary format, device profiles, and metadata instead of reimplementing an e-book format from scratch. |
| Device detection | PowerShell (Get-Volume) |
Reliable, native way to find a USB volume by label on Windows without adding a Python dependency just for that. |
| GUI | tkinter | Ships with the standard Windows Python installer — the app requires nothing beyond “install Python” to run. |
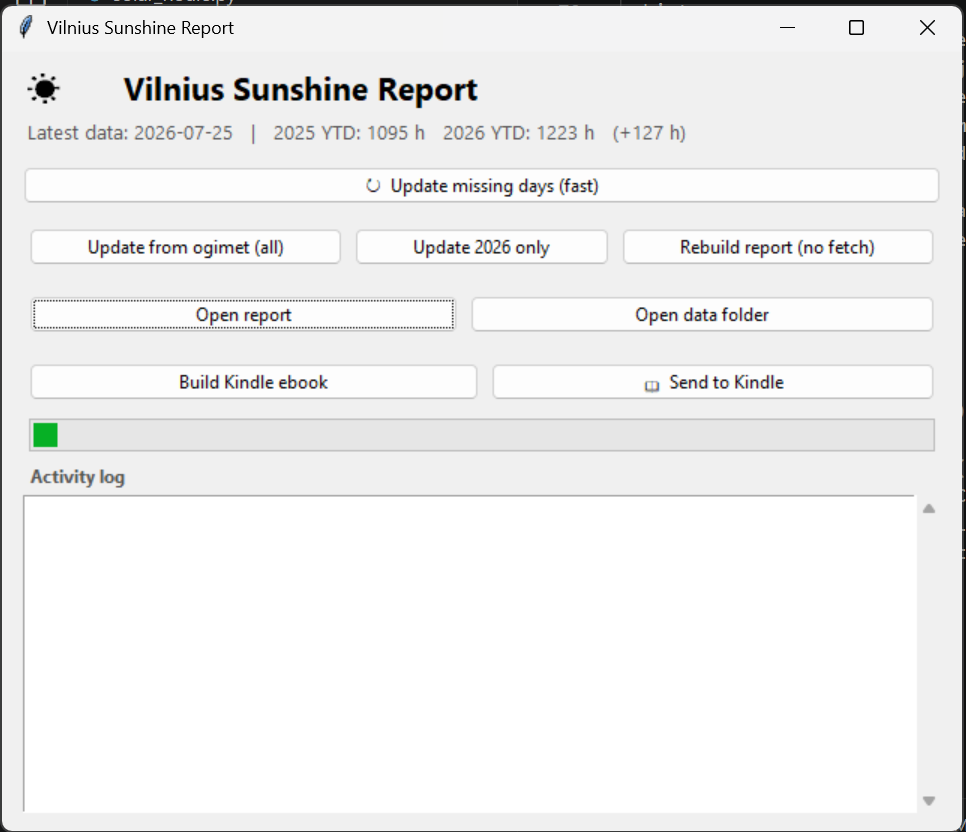
The desktop GUI — one-click fetch, rebuild, and Send to Kindle. Click to enlarge.
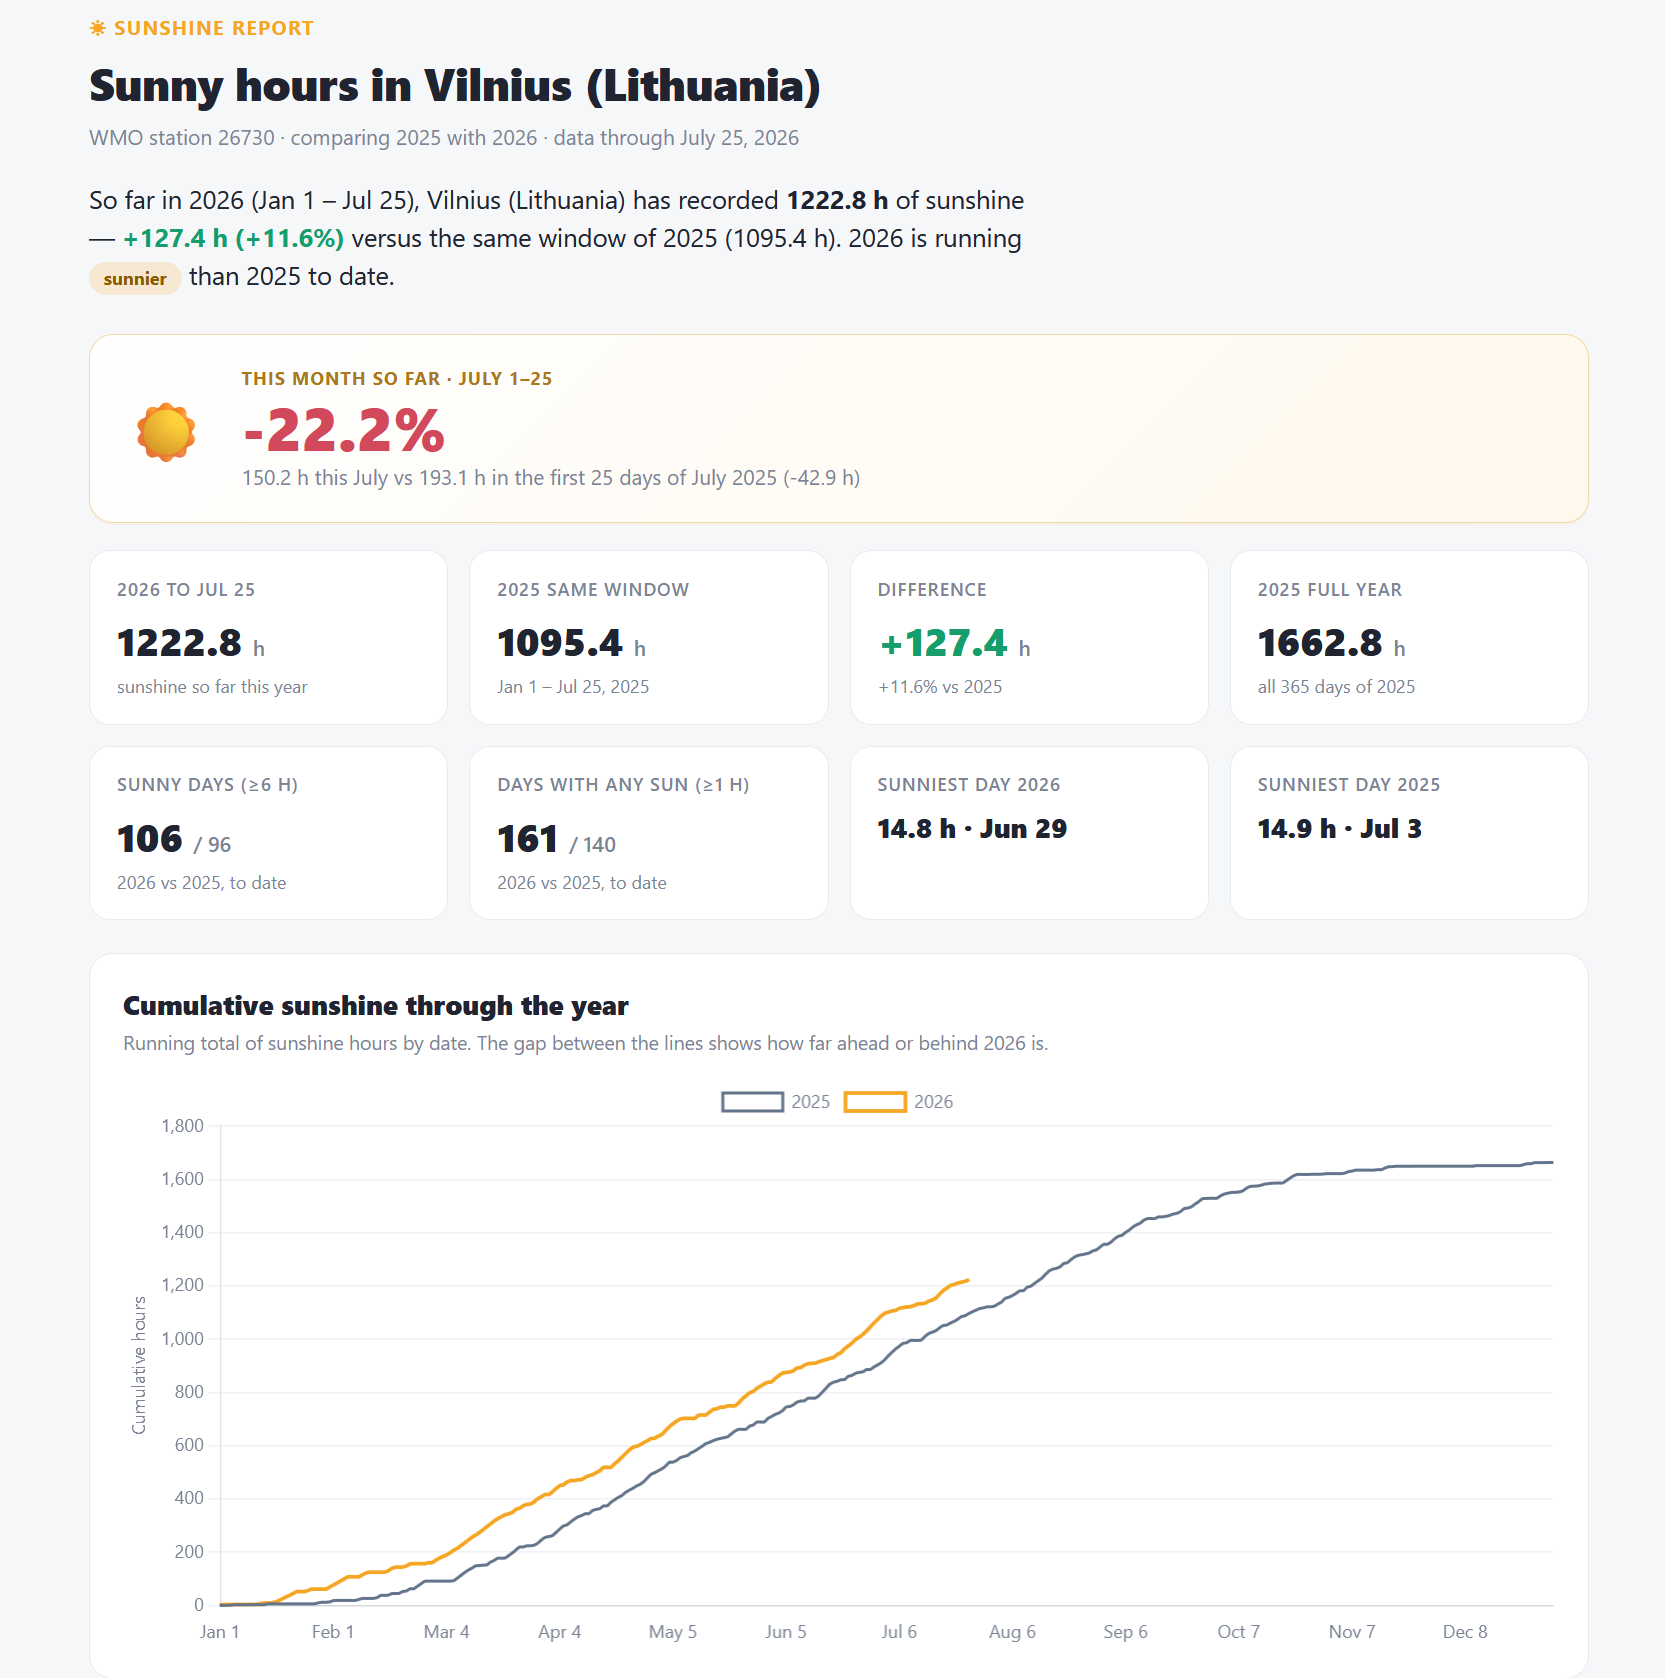
The interactive HTML dashboard — cumulative sunshine, 2025 vs. 2026. Click to enlarge.
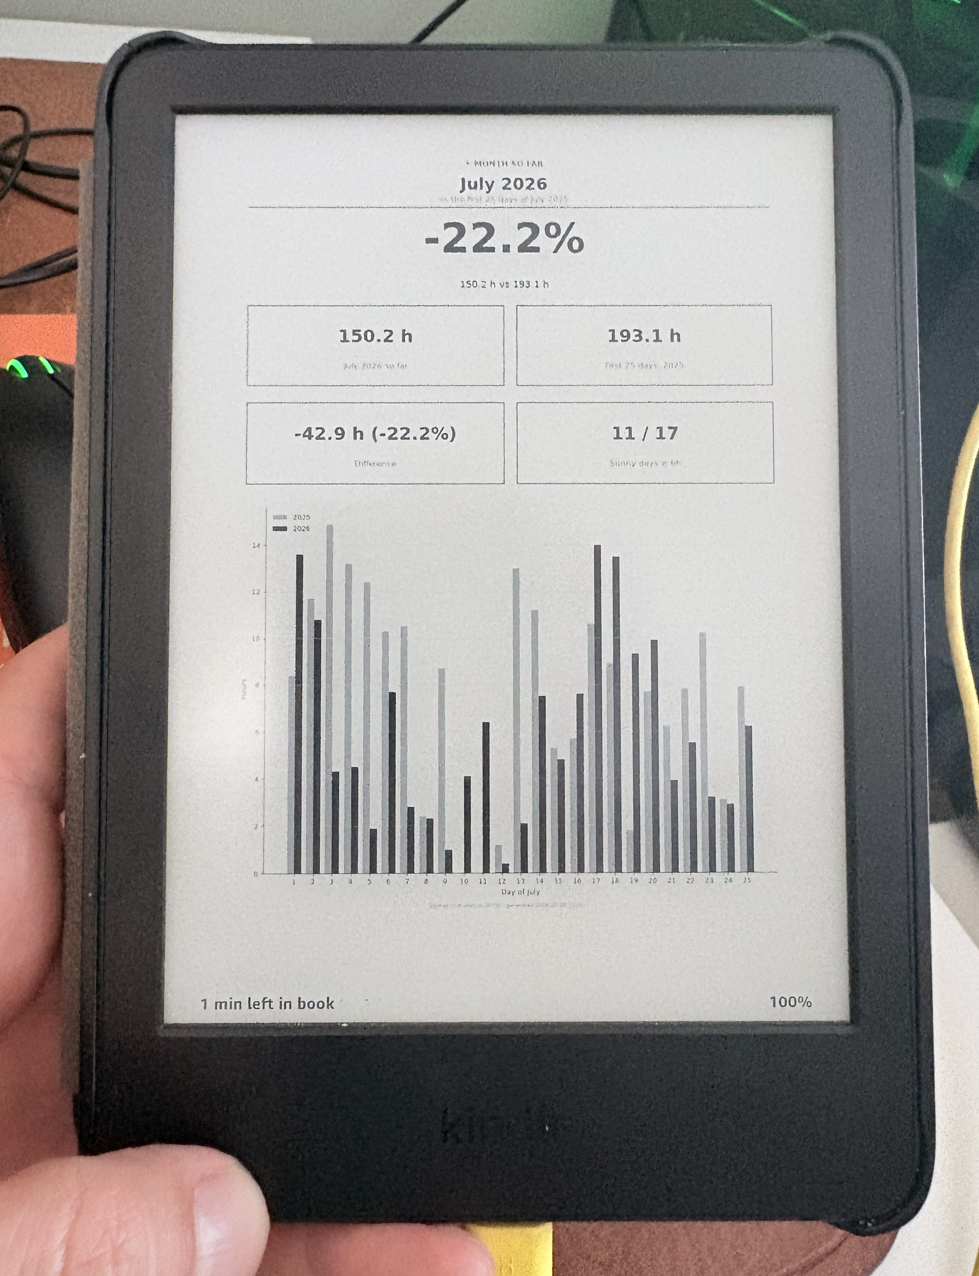
The Kindle edition — a matplotlib-rendered digest, converted with Calibre. Click to enlarge.